Hyperliquid Portfolio Tracker: How to Monitor Positions & PnL (2026)
Table of Contents
- The Hyperliquid Dashboard
- Trade Page
- Portfolio Page
- How to Read the Positions Panel
- Position Actions
- Tracking Account Performance
- Account Value Over Time
- Margin Utilization
- Funding History
- Exporting Trade History
- How to Export
- What the Export Includes
- Using Exports for Performance Analysis
- Third-Party Tracking Tools
- DeBank
- CoinStats
- Nansen
- Coinglass
- Hyperliquid Info API
- Dune
- On-Chain Verification
- Setting Up Position Alerts
- TP/SL as Alert Proxies
- TradingView Alerts
- Custom API-Based Alerts
- Putting It All Together
Info
Quick Summary - Hyperliquid Portfolio Tracking
- The Portfolio page on app.hyperliquid.xyz shows all open positions, PnL, margin usage, and account value in real time
- The Positions panel on the Trade page displays entry price, mark price, unrealized PnL, leverage, and liquidation price per position
- Export trade history as CSV from the Portfolio page - includes fills, funding payments, deposits, and withdrawals
- Third-party trackers like DeBank and Coinglass support Hyperliquid wallet monitoring
- The Hyperliquid Info API enables programmatic portfolio tracking and custom dashboards
Knowing where you stand at all times is a prerequisite for profitable trading. On centralized exchanges, portfolio dashboards are table-stakes features - but on a decentralized perpetuals exchange like Hyperliquid, the tracking experience is actually superior in many ways. Every position, every fill, every funding payment is tied to your wallet address and visible on-chain, which means you can verify your data independently and feed it into any analytics tool you choose.
This guide covers the full toolkit: the native Hyperliquid dashboard, how to read each data point in the positions panel, account-level performance metrics, trade history exports, and third-party trackers that aggregate your Hyperliquid activity alongside the rest of your DeFi portfolio.
The Hyperliquid Dashboard
The Hyperliquid trading interface is divided into two primary views for portfolio monitoring: the Trade page and the Portfolio page.
Trade Page
The Trade page is where most active traders spend their time. Along with the order book, chart, and order entry form, it includes a persistent Positions panel at the bottom of the screen. This panel updates in real time and shows every open position across all markets - you never need to navigate away from your chart to check your PnL.
Above the positions panel, you will see your Account Value - the total equity in your trading account, denominated in USDC. This figure updates tick-by-tick as your unrealized PnL changes. Next to it, the Available Margin indicator shows how much collateral you have left to open new positions or absorb drawdowns.
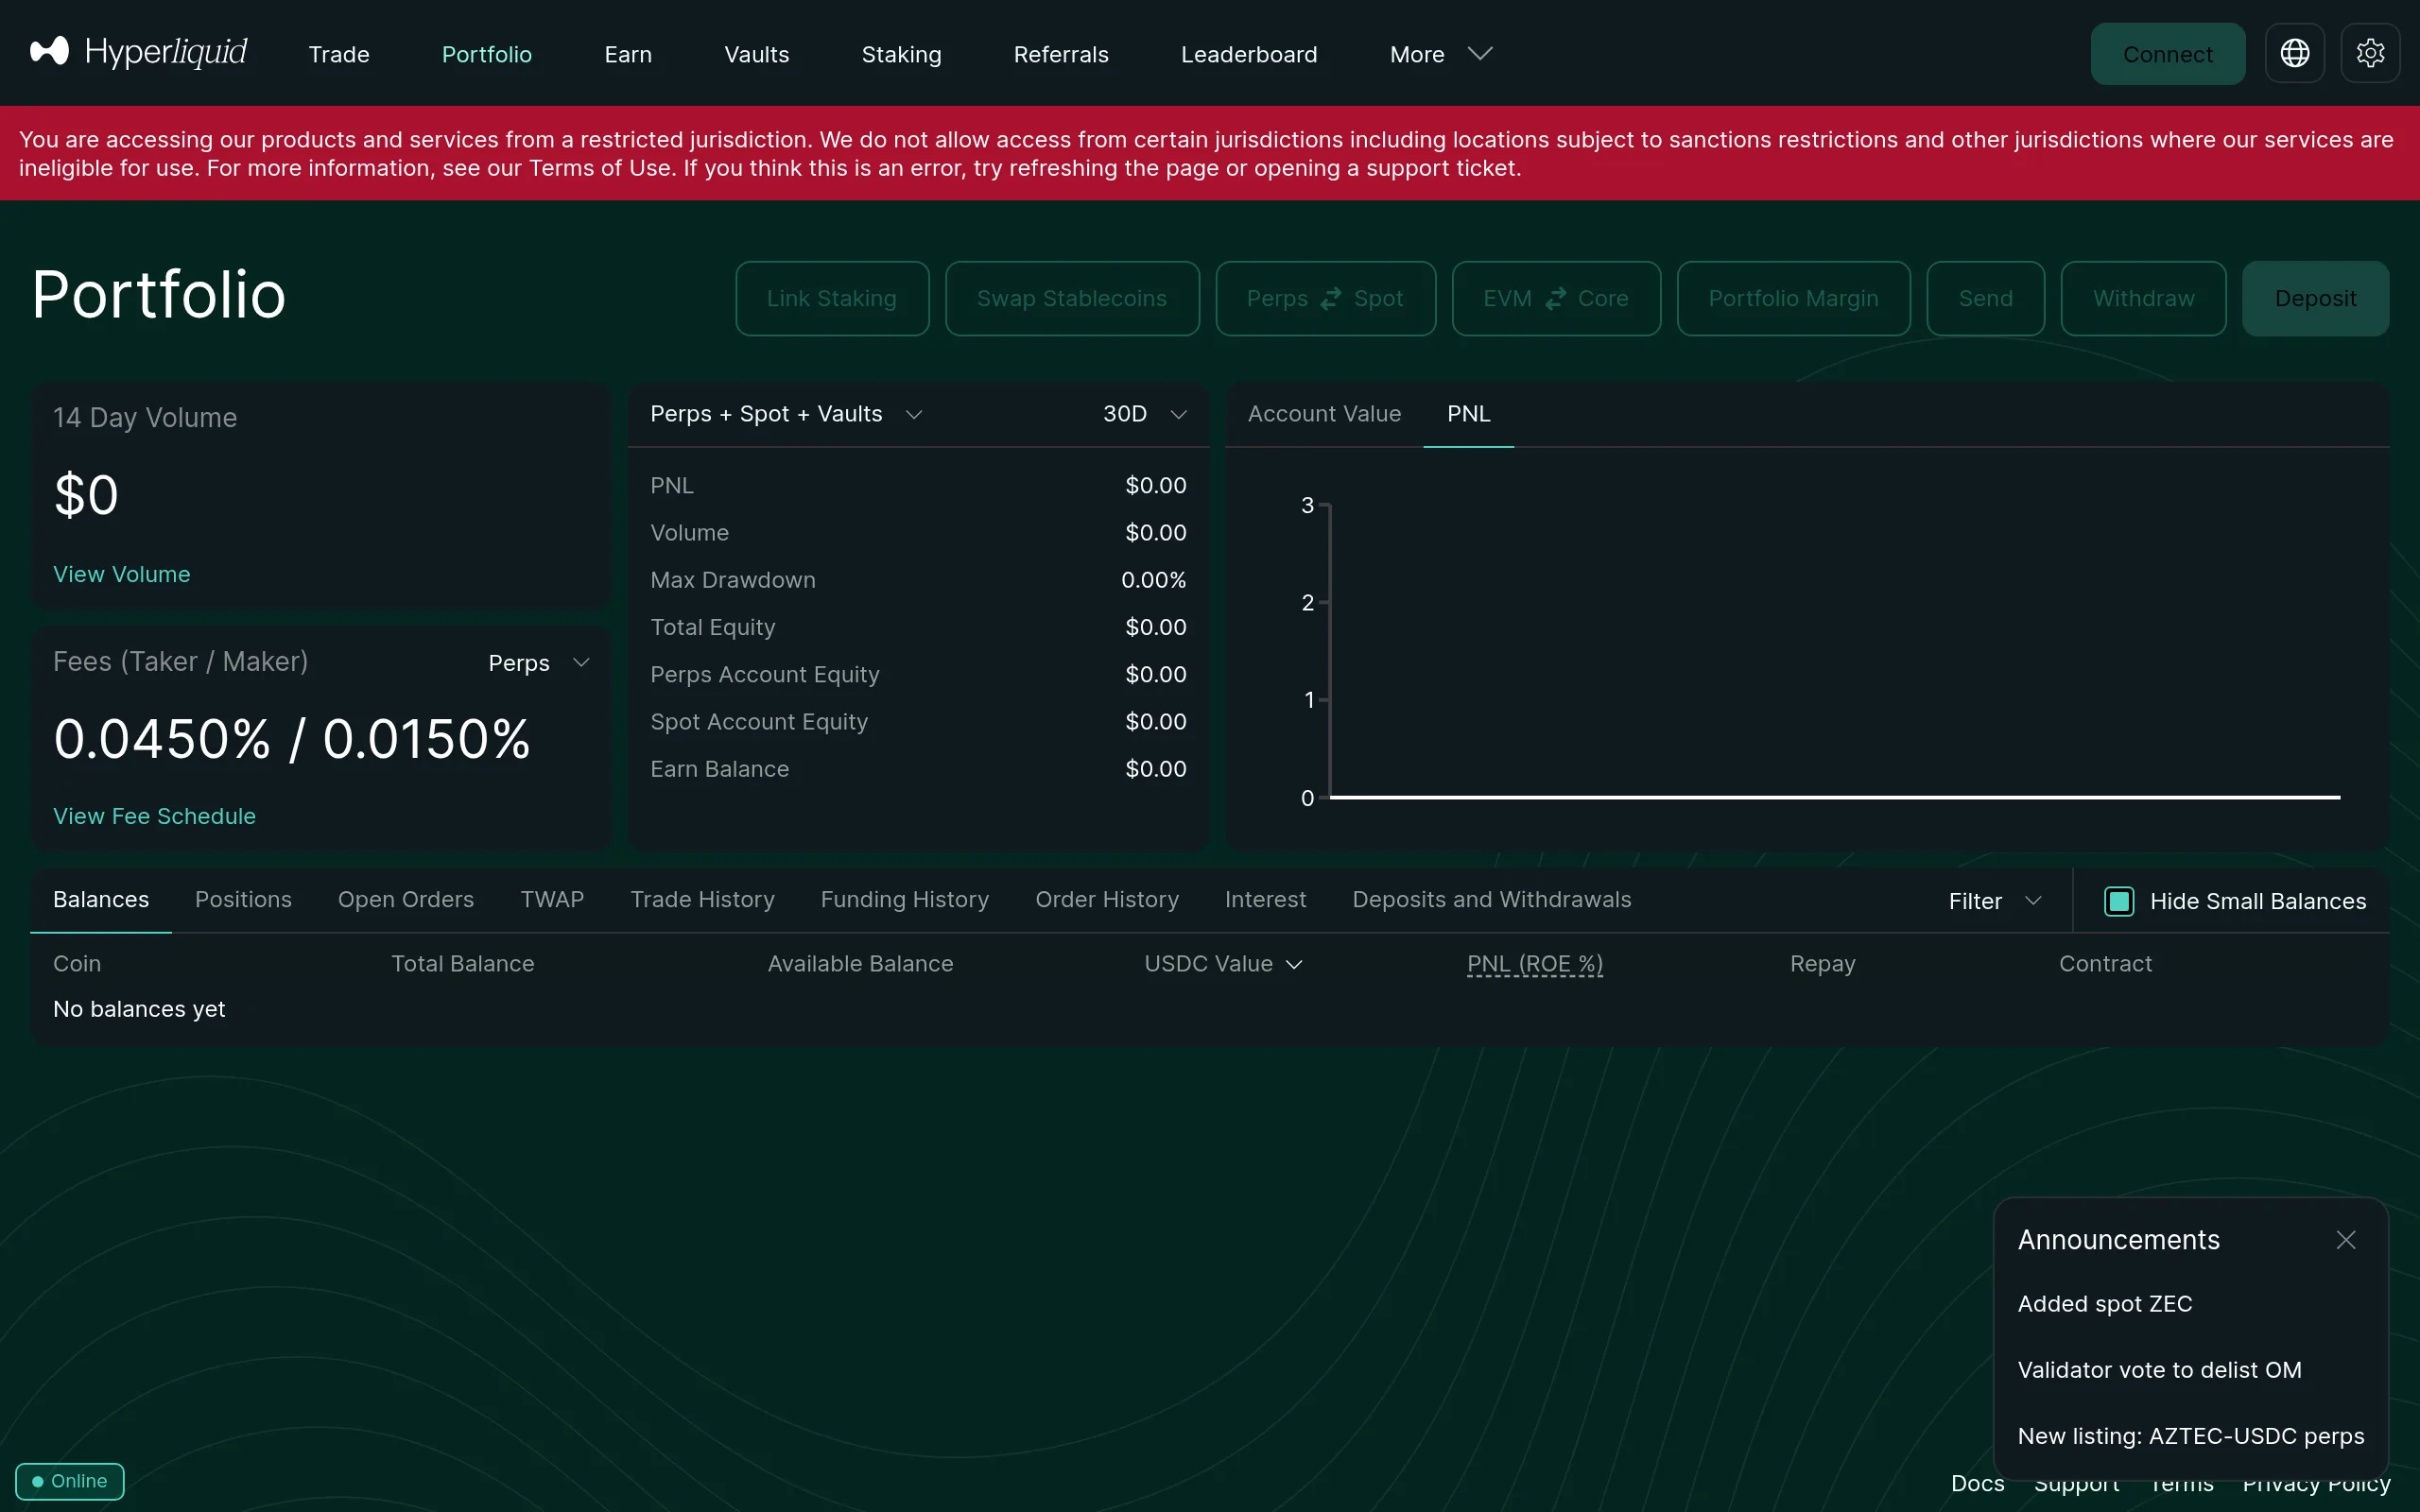
Portfolio Page
The Portfolio page provides a broader view of your account. It includes:
- Account summary - total equity, available margin, cross-margin ratio, and total unrealized PnL across all positions
- Open positions - the same positions panel from the Trade page, but with more screen space
- Open orders - all resting limit orders, stop-losses, and take-profits
- Trade history - a searchable, sortable log of every executed fill
- Funding history - a record of all funding rate payments received and paid
- Transfer history - deposits, withdrawals, and internal transfers
The Portfolio page is your single source of truth for account health. Check it daily - not just to see PnL, but to review margin utilization and ensure no position is approaching its liquidation threshold.
How to Read the Positions Panel
The positions panel is the most information-dense component of the Hyperliquid interface. Understanding each column is essential for managing risk effectively.
| Column | Description |
|---|---|
| Asset | The trading pair (e.g., BTC-PERP, ETH-PERP). A green arrow indicates a long position; red indicates short. |
| Size | The notional value of your position in USD. This is your leverage-adjusted exposure - a $1,000 margin position at 10x shows as $10,000 size. |
| Entry Price | The volume-weighted average price at which you entered the position. If you scaled into a trade across multiple fills, this reflects the blended average. |
| Mark Price | The current fair price used to calculate unrealized PnL. Hyperliquid uses an oracle-based mark price to prevent manipulation and unnecessary liquidations. |
| Unrealized PnL | Your profit or loss if you were to close the position at the current mark price. Displayed in both USD and percentage terms. Green text means profit, red means loss. |
| Leverage | The effective leverage of the position, calculated as position size divided by your allocated margin. |
| Liq. Price | The mark price at which your position would be liquidated. In cross-margin mode, this factors in your entire account balance, not just the margin allocated to that specific position. |
| TP/SL | Any take-profit or stop-loss orders attached to the position. |
Tip
Pay special attention to the Liq. Price column. If you are using cross margin, your liquidation price shifts as you open or close other positions - a new losing trade on a different asset can bring your existing positions closer to liquidation. Consider using isolated margin for high-conviction directional bets to ring-fence risk.
Position Actions
Each row in the positions panel includes action buttons:
- Close - market-close the entire position immediately
- Limit Close - set a limit order to close at a specific price
- TP/SL - add or modify take-profit and stop-loss levels
- Share - generate a shareable PnL card (useful for social media)
- Adjust Margin - add or remove margin from the position (isolated margin mode only)
Tracking Account Performance
Beyond individual positions, Hyperliquid provides several account-level metrics that serious traders should monitor regularly.
Account Value Over Time
Your total account value is displayed at the top of the Portfolio page. While the interface shows the current snapshot, you can track performance over time by noting your account value at regular intervals or by using the trade history export to reconstruct your equity curve.
Margin Utilization
Margin utilization is the percentage of your total equity currently committed to open positions. High margin utilization (above 70-80%) leaves little room for adverse price moves and increases your risk of cascading liquidations in volatile markets.
A healthy margin utilization for most traders is between 20% and 50%. If you find yourself consistently above 60%, consider reducing position sizes or closing your weakest-conviction trades.
Funding History
Funding payments on Hyperliquid settle every hour - that is 8,760 funding events per year for a single open position. These micro-payments add up quickly and can significantly impact your net PnL.
The Funding History tab on the Portfolio page shows every funding payment you have received or paid, broken down by asset and timestamp. If you hold positions for days or weeks, review this tab to understand how much funding is costing (or earning) you. For a deeper understanding of how funding rates work, see our funding rates explained guide.
Exporting Trade History
Hyperliquid lets you export your full trade history as a CSV file - essential for performance analysis, tax reporting, and feeding data into external analytics tools.
How to Export
- Navigate to the Portfolio page on app.hyperliquid.xyz
- Open the Trade History tab
- Select your desired date range or choose "All Time"
- Click the Export button to download a CSV file
What the Export Includes
The CSV export contains:
- Fills - every executed trade, including asset, side (buy/sell), size, price, fee, and timestamp
- Funding payments - all hourly funding credits and debits
- Deposits and withdrawals - USDC transfers to and from your trading account
- Liquidations - any positions that were forcibly closed, with the liquidation price and loss amount
Info
For programmatic access, the Hyperliquid Info API provides the same data in JSON format. The userFills, userFunding, and userNonFundingLedgerUpdates endpoints return your complete trading history for any wallet address. This is the preferred approach for building automated tracking dashboards or integrating with tax software like ![]() Koinly or CoinTracker - though Koinly can now read a Hyperliquid address directly, so most people never touch the API. Our tax reporting guide covers the export path either way.
Koinly or CoinTracker - though Koinly can now read a Hyperliquid address directly, so most people never touch the API. Our tax reporting guide covers the export path either way.
Using Exports for Performance Analysis
Raw trade data becomes powerful when you analyze it properly. Import your CSV into a spreadsheet or analytics tool and calculate:
- Win rate - percentage of trades closed at a profit
- Average win vs. average loss - your reward-to-risk ratio in practice
- Profit factor - total gross profit divided by total gross loss (above 1.5 is strong)
- Maximum drawdown - the largest peak-to-trough decline in account value
- Net funding impact - total funding received minus total funding paid
These metrics tell you more about your trading edge than raw PnL ever will. A trader with a 40% win rate can be highly profitable if their average win is 3x their average loss.
Export your trade history at least monthly. Reviewing your win rate, profit factor, and funding impact reveals patterns that are invisible when you only look at your current PnL number.
Third-Party Tracking Tools
While the native Hyperliquid interface covers the essentials, third-party tools add aggregation, visualization, and alerting capabilities that the platform does not offer natively.
 DeBank
DeBank is a multi-chain DeFi portfolio tracker that supports Hyperliquid. Connect or paste your wallet address to see your Hyperliquid positions alongside your holdings on Ethereum, Arbitrum, and other chains. DeBank is particularly useful if you have assets spread across multiple protocols and want a single unified view. It is free, and it reads addresses only - there is nothing to connect and nothing to pay for.
 CoinStats
DeBank sees on-chain. It does not see the balance sitting on a centralized exchange, and for most people that is a meaningful slice of the total. CoinStats closes that gap by pulling exchange accounts and on-chain wallets into one number, with mobile apps and price alerting on top. The free tier covers a handful of connections; the paid tier is where the unlimited syncing and portfolio analytics live.
 Nansen
Nansen is a different category - less "what do I hold" and more "what is everyone else doing." Its wallet labelling is the draw: on Hyperliquid that means watching how large HYPE holders and HyperEVM protocol treasuries actually move, rather than inferring it from price. It is expensive and most traders do not need it. If your edge comes from flow rather than charts, it is the best version of that tool.
Coinglass
Coinglass tracks open interest, liquidation data, and funding rates across major perpetual exchanges - including Hyperliquid. While it is more of a market analytics tool than a personal portfolio tracker, it provides valuable context: you can see aggregate positioning, long/short ratios, and liquidation heatmaps that inform your risk management decisions.
Hyperliquid Info API
For technically inclined traders, the Hyperliquid Info API (https://api.hyperliquid.xyz/info) is the most flexible option. It is a public POST API - no authentication required - that returns real-time and historical data for any wallet address.
Key endpoints for portfolio tracking:
userState- current positions, account value, margin usageuserFills- complete trade history with fills and feesuserFunding- all funding paymentsuserNonFundingLedgerUpdates- deposits, withdrawals, liquidations
You can build custom dashboards, Telegram bots, or automated alerting systems using this API. Several community-built trading tools already leverage these endpoints for advanced analytics.
 Dune
Dune
If you would rather write SQL than call an API, Dune announced HyperCore support in July 2026, covering orders, fills, funding, the order book, and HIP-4 outcome markets. Fork a community Hyperliquid dashboard and filter it to your address rather than starting from a blank query. One caveat: the publicly documented hyperliquid.market_data table refreshes monthly, so for your own live position and fill history the API endpoints above are still the better source.
Not a coder? We wrap the same API into a copy-paste widget you can embed on any site - live prices, funding rates, or a liquidation calculator, no build step required.
Put this data on your own site — free
Build a live Hyperliquid widget in seconds: liquidation calculator, funding-rate ticker, or scrolling marquee. Pick your markets and colors, then copy one snippet. No account, no cost.
Build your free widgetOn-Chain Verification
Because Hyperliquid settles on its own L1, your trading activity is verifiable on-chain. Block explorers and analytics tools can independently confirm your positions and fills, providing an extra layer of transparency that centralized exchanges cannot match.
Setting Up Position Alerts
Hyperliquid does not currently offer built-in push notifications for price or PnL thresholds, but there are several effective workarounds.
TP/SL as Alert Proxies
The simplest approach is to use take-profit and stop-loss orders as de facto alerts. Set a TP/SL on every position as soon as you open it. Even if you plan to manage the exit manually, having a stop-loss in place ensures you are protected if you step away from the screen.
TradingView Alerts
If you chart on TradingView, set price alerts on the assets you are trading. TradingView supports push notifications, email, and webhook alerts - you will be notified the moment price hits a level that matters for your Hyperliquid positions.
Custom API-Based Alerts
Using the Hyperliquid Info API, you can build a simple script that polls your userState every few seconds and sends a notification (via Telegram, Discord, or email) when:
- Unrealized PnL crosses a threshold (e.g., -5% on any position)
- Margin utilization exceeds a safe level (e.g., above 70%)
- A position's mark price approaches its liquidation price
- Funding rate on a held asset spikes above a threshold
This is the most powerful approach and only requires basic programming knowledge. Python scripts using the requests library can query the API and send alerts via Telegram's Bot API in under 50 lines of code.
Tip
At minimum, set a stop-loss on every position - it is the simplest and most reliable "alert" you can have. No tracking tool replaces proper risk management. Review our leverage trading guide for best practices on setting stop-losses and managing risk.
Putting It All Together
Effective portfolio tracking on Hyperliquid is a layered approach:
- Real-time monitoring - use the native Trade page positions panel for live PnL and margin data
- Daily review - check the Portfolio page for account health, funding impact, and open orders
- Weekly/monthly analysis - export trade history and calculate performance metrics (win rate, profit factor, drawdown)
- Aggregated view - use DeBank or CoinStats if your balances are spread across multiple protocols and exchanges (the full list lives in our trader's stack)
- Automated alerts - set TP/SL orders on every position, and consider API-based alerts for margin and PnL thresholds
Understanding your fee impact is also part of the picture - fees and funding payments are real costs that directly reduce your net returns.
The traders who consistently profit are the ones who treat trading as a data-driven activity. Track everything, analyze regularly, and let the numbers guide your decisions.
Frequently Asked Questions
The Hyperliquid interface at app.hyperliquid.xyz shows all open positions, unrealized PnL, margin usage, and account value in real time. Navigate to the Portfolio or Trade page to view your positions. Each position shows entry price, mark price, size, leverage, PnL percentage, and liquidation price.
Yes. Go to the Portfolio page on app.hyperliquid.xyz and use the trade history export function to download your complete trading history as a CSV file. This includes fills, funding payments, deposits, and withdrawals. The export is useful for tax reporting and performance analysis.
Yes. Several third-party tools support Hyperliquid wallet tracking, including DeBank for overall DeFi portfolio monitoring, Coinglass for positions and liquidation data, and the Hyperliquid API for custom tracking solutions. Simply enter your wallet address to view your positions and history.
Each row in the positions panel shows: the asset and direction (long/short), position size in USD, entry price, current mark price, unrealized PnL in both dollar and percentage terms, leverage used, and your liquidation price. Green indicates profit, red indicates loss.
Disclaimer: This content is for informational purposes only and does not constitute financial advice. Trading perpetual futures involves substantial risk of loss. Past performance is not indicative of future results. Always do your own research before trading. This site contains referral links: signing up through our 4% lifetime fee discount code earns us a share of the trading fee Hyperliquid already charges, at no extra cost to you.
Ready to Start Trading?
Join Hyperliquid with our referral link and get a 4% lifetime fee discount. No KYC, no email - just connect your wallet and trade.
Start Trading - Save 4%